Ferry Travelers Love Beach Life
For Shore Towns in South Jersey, the amount of time and dollars visitors spend in local areas is a large part of their bread and butter. Each town knows when it’s had a good year or bad year, but not always why. In bad years, when there’s a hurricane or weather event, the effect on tourism spending is quickly recognized. Similarly, the effects of COVID on the traveling public was immediate, devastating and easy to track.
Ironically, it’s in the good years, that it’s more difficult to determine the effects any one program or service has on the economy of an area. To help, planners at all levels — federal to local — increasingly use economic tools that integrate data from multiple sources. These models determine the value of investing in various projects from road development to grants for specialty industry and career development.
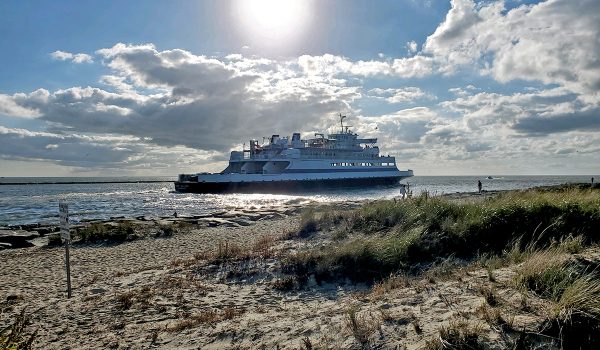
Because the Cape May-Lewes Ferry is not funded by public monies, it is not included in state and regional studies. So, in 2019, with lots of new capital projects on the horizon for the Ferry including a new Marine Master Plan, the DRBA engaged an economics consulting team to gain important information in support on ongoing economic development projects. The study found that for every $1 the DRBA invests in the Ferry operation, $20 of value is received in wages, affiliated jobs and business growth in the communities closest to the Ferry. For more on study finding details click the button below.
Passengers Stay Largely Local
In addition to the economics study, for the past several years, the marketing team at the Cape May-Lewes Ferry has been conducting monthly market research surveys of ferry passengers to learn more about where they are going after they get off the ferry. When reservations are made limited data is collected on passengers — whatever is necessary to complete a reservation, but not enough to assist in marketing efforts. In order to determine where to best advertise for future passengers and what marketing partnerships might make the most sense to provide best customer travel packages, the marketing team needed to know where people were going and what they liked to do.
The most interesting finding: Even though passengers travel as far as Canada to Florida, the vast majority leave from their homes in the mid-Atlantic and take the Ferry for vacations close to the Delaware Bay!
Top Three Destinations
For all passengers, regardless of the time of year the top three destinations are:
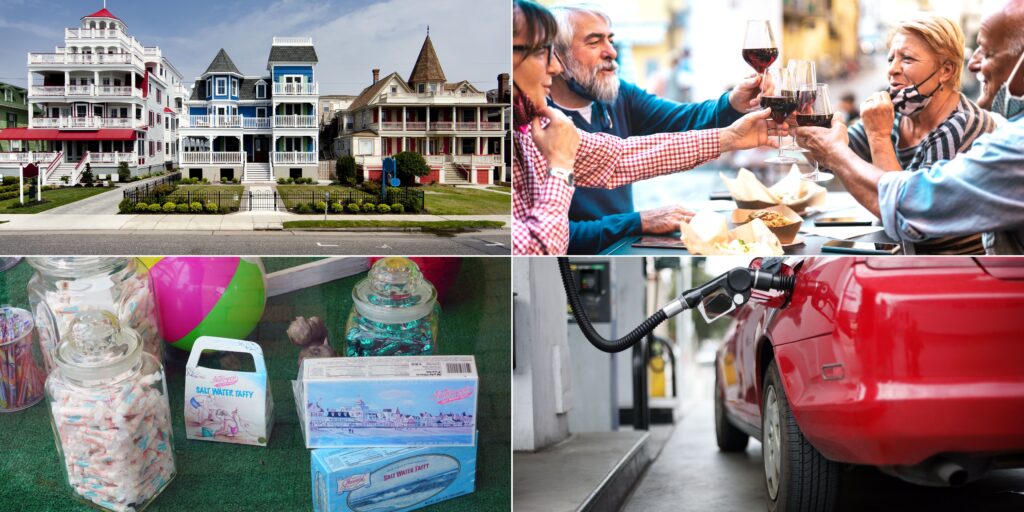
- Cape May
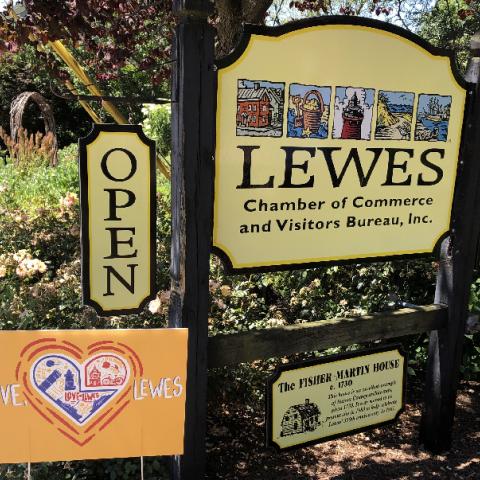
- Lewes
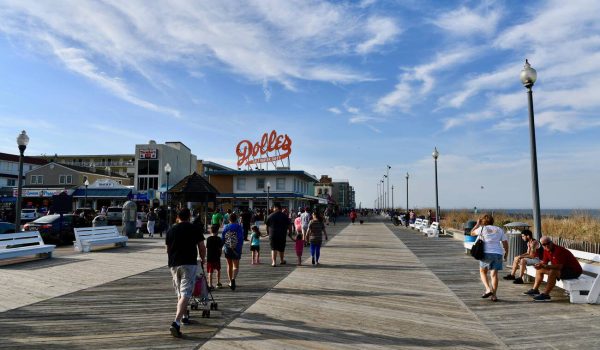
- Rehoboth/Dewey Beach
The #4 destination varies by season with The Wildwoods taking the spot in the warmer months and Atlantic City consistently in the #4 spot in the winter and colder months.
In terms of numbers, that means that in a typical year, the Ferry brings more than 137,000 people to Cape May, 92,000 people to Lewes, 88,500 to Rehoboth/Dewey, 45,500 to Atlantic City and 44,369 to The Wildwoods. This does not include people who also stop in those towns for quick stops while passing through to destinations farther north or south.
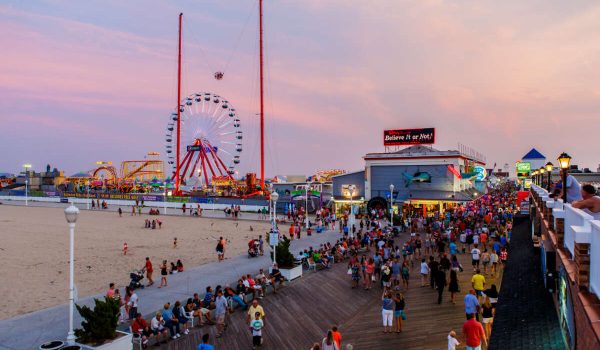
In addition to our local hotspots, southbound passengers frequently cited Fenwick Island, Ocean City MD, Virginia Beach, Assateague and Chincoteague as top destinations. Northbound passengers said Downbeach, Brigantine, LBI, Manahawkin and other Jersey Shore points were top places visited.
Research Continues
This is the second in a series of reports we hope to issue this year on travel information supplied by ferry passengers, with the first on the topline findings of the economic report. Future reports will highlight specific attractions passengers like to visit, and estimates on how they say they sped their tourism dollars.
In June 2021, market research studies will again be conducted with new questions about passenger travel plans and desires for Ferry services. In addition, we are planning to update data on our Ferry services relative to other ferry systems in the U.S. and learn more about how we stack up against other ferry systems in terms of economic value provided to our service area.
This type of research works best with several years of data to allow for trend analysis and year over year comparisons.
